Software for analyzing brain activity patterns of laboratory mice
Software for the analysis and visualization of discrete fluorescence signal data of the brain neurons of laboratory mice obtained with a miniscope as part of research on neurodegenerative diseases.
Task
Research on the treatment of neurodegenerative diseases is being conducted all over the world. Pathologies such as Alzheimer’s or Parkinson’s disease cause the destruction of parts of the brain that control memory, socialization, and motor function. Most of these diseases are asymptomatic for a long time, but they progress rapidly and inevitably lead to the disability of the patient. According to the Bekhtereva Institute of the Human Brain, the incidence of neurodegenerative diseases is predicted to exceed 5% already by 2050. As part of global research in this area, SPbPU is implementing the project “Investigation of neural network activity changes caused by neurodegenerative diseases using artificial intelligence methods.”
The Laboratory of Molecular Neurodegeneration at the HSBSiT, Institute of Biomedical Sciences and Technologies, SPbPU, led by I.B. Bezprozvanny, has integrated technology for visualizing brain neuronal activity in free-moving mice using a miniscope (miniature fluorescence microscope).
Using the miniscope makes it possible to obtain images of previously inaccessible populations of neurons deep in the brain and record the activity of the neuronal network in awake free-moving animals over a long period. The video recording generates a huge amount of data, which are discrete signals of neuronal fluorescence.
The enormous potential of the obtained information was obvious, but specialized software was required for further analysis of the signals in order to determine hidden patterns.
The task of the staff of the ISSDP Laboratory in this project was to develop a software module to analyze data on the neuronal activity of the brains of laboratory mice and visualize the information for researchers.
Solution
The prototype software module NeuroInfoViewer processes the imported video of the experiment obtained with a miniscope, builds a correlation analysis of neuronal activity on its basis, and displays the results in graphical form.
The miniscope is a miniature fluorescence microscope developed by Mark Schnitzer’s lab. It is used to fluorescently visualize the neural activity of awake free-moving animals. Using a GRIN2 (gradient refractive index) lens implanted in the brain, the device transmits light and allows visualization of deep layers of the brain. The average weight of such a microscope is 3 grams. A flexible coaxial cable with a diameter of 0.3 to 1.5 mm is used for power, control, and transmission of images to a PC.
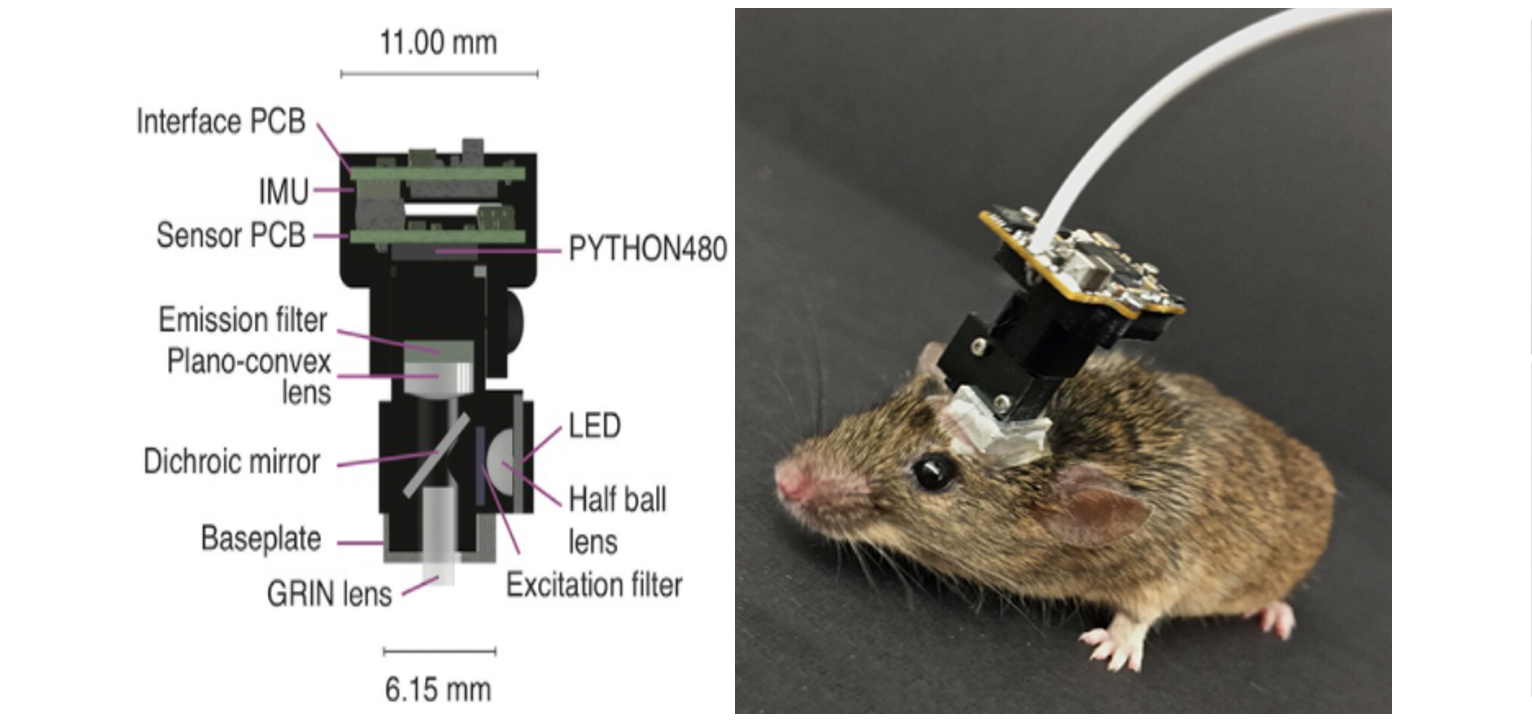
Scheme of a single-photon miniature microscope
An example of miniscope recordings (data provided by Professor Weidong Li, Shanghai Jiao Tong University, Shanghai, China) was demonstrated in the report of I.B. Bezprozvanny at the 16th All-Russian Conference “Academician L.A. Orbeli Meeting on Evolutionary Physiology” (Orbeli 2020).
As part of the technology for visualization of brain neuronal activity in free-moving mice, integrated with the Laboratory of Molecular Neurodegeneration at HSBSiT IBSiB SPbPU, the data obtained from the miniscope go through several processing steps:
- Conversion of video sequence file from *.avi to *.tif
- CNMF-E processing (a method for extracting individual neuron activity from in vivo data)
- Data export from CNMF-E into CSV format
- The data obtained are processed by the NeuroInfoViewer software module.
The data obtained after CNMF_E processing are discrete neuronal fluorescence signals. For their further analysis, it is necessary to extract the significant parameters of a given signal. The values of the parameters may vary depending on the region under study and the signal-to-noise ratio.
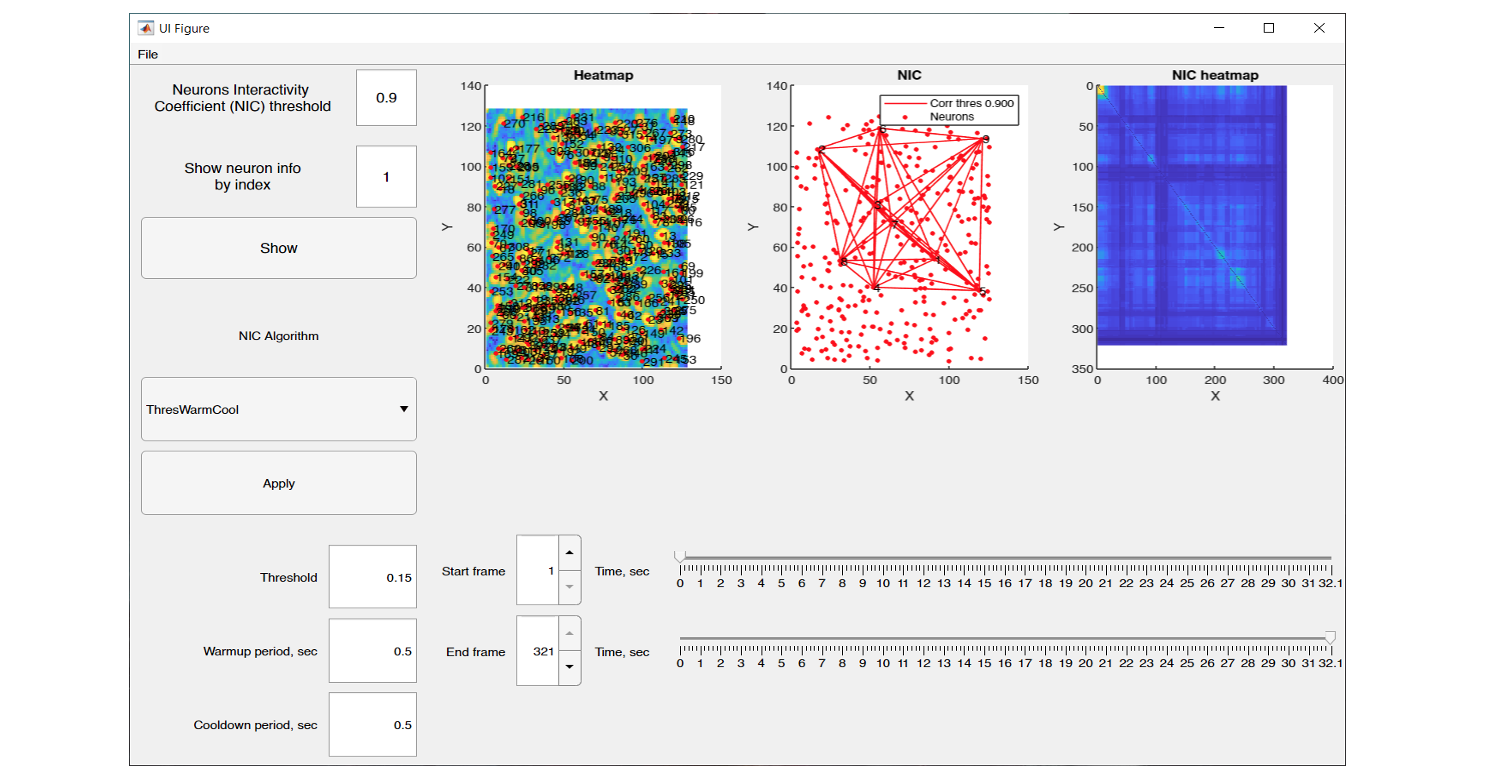
The graphical interface of NeuroInfoViewer provides the user with an image of the neuronal activity at a selected point in time and also builds a heat map of their correlation.

NeuroInfoViewer prototype interface and data processing results from one of the experiments
The NeuroInfoViewer software module combines video signal processing algorithms and various data analytics methods to calculate correlation dependencies of neuronal activity on a set of the following parameters:
- The activity of an individual neuron;
- Exceeding the threshold activity of a neuron;
- Simultaneous activity of neurons;
- Visualization of the obtained correlation dependencies;
- Visualization of data for each neuron separately.
Subsequent versions of the software are planned to be supplemented with:
- A function for comparing the neural activity of a single rodent across multiple experiments;
- The function of high-level analysis.
Details
NeuroInfoViewer consists of several files: NIV.mlapp (the main source file of MATLAB application) and useviewneuron2.m (function to display information about one neuron). All data processing is done by the DataUpdate function. Depending on the selected algorithm, one of the three NIC (Neuron Interactivity Coefficient) functions is performed.
The algorithms used:
- NonZeroSpikeFramesIntersec algorithm (alias Alg1) for the visual representation of correlations in neural activity;
- ThresWarmCool algorithm for additional filtering of raw calcium;
- SignalCrossCorrMax algorithm to plot the mutual correlation of signals.
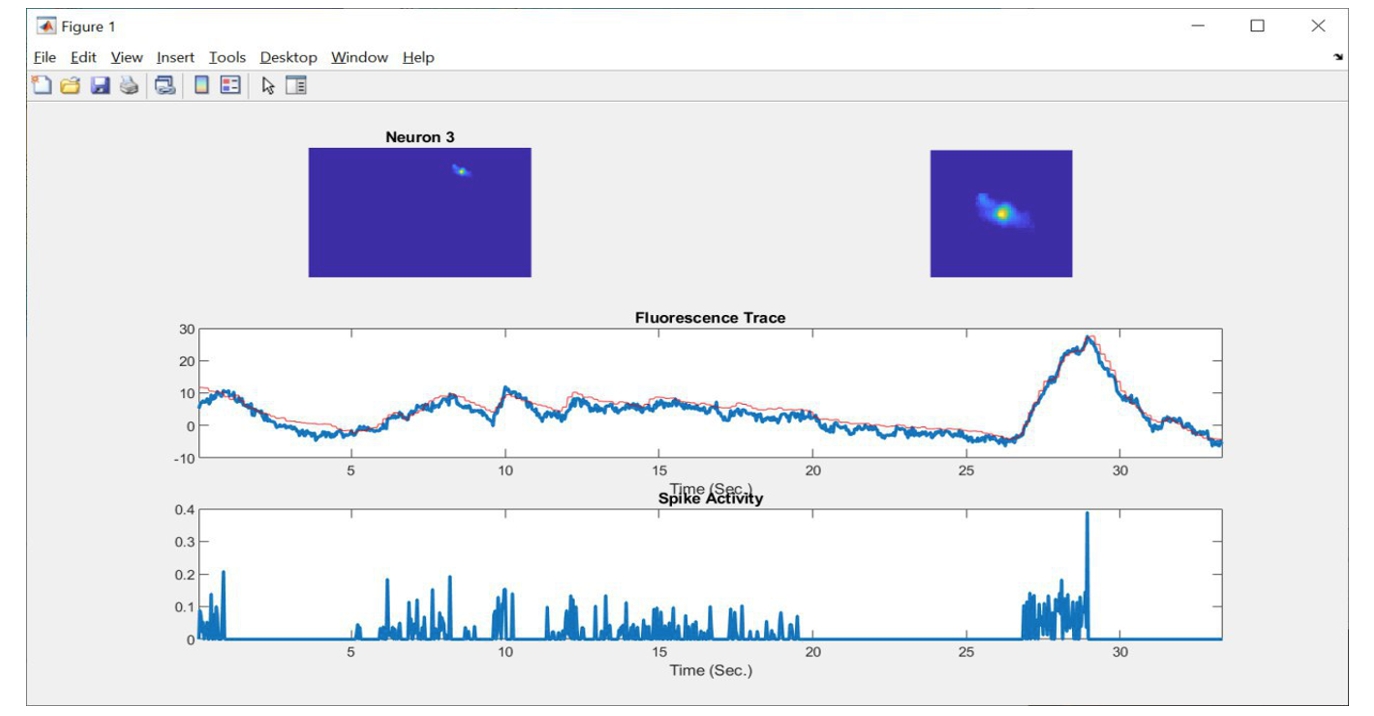
Visualization of activity of a single neuron
After calculating the pairwise correlation between neurons, it is possible to export from NIV the following files: 3 images in *.fig and *.png format, namely, the heat map of neurons (heat map), the neuron interactivity factor (neuron correlation), and the heat map of neuron correlation (NIC heat map), as well as the matrix of pair correlation in *.csv format.
Technologies
| Языки программирования и фреймворки: |
MATLAB |
| OS: |
Linux,Windows |
| CVS: |
Git (Gitlab) |
Intellectual Property
Publications
This work was supported by a project grant from Peter the Great St. Petersburg Polytechnic University as part of the Program for Enhancing the Competitiveness of Russia's Leading Universities among the World’s Leading Scientific and Educational Centers (Project 5-100) for 2020 and with the support of Russian Science Foundation grant 19-15-00184 (I.B.)
Project team
- Project director: Professor I.B. Bezprozvanny, Doctor of Biology, head of the Laboratory of Molecular Neurodegeneration of SPbPU, Professor at the HSBSiT IBSiB SPbPU
- Co-director: M.V. Bolsunovskaya, Head of the Industrial Systems for Streaming Data Processing Laboratory, NTI Center, SPbPU
- Lead developer: D.S. Barinov